
The climate intelligence layer for cities and buildings.
Simulate how a design changes wind, heat, sun and daylight — from a room to a city.
Fast metre‑resolution simulation for wind
Interior daylight · per floor · 0.8 s
0100
Simulate how a design changes wind, heat, sun and daylight — from a room to a city.
Fast metre‑resolution simulation for wind







01
Weather and 3D geometry go in. Local climate simulations come out. Change a building, add shade or plant trees — then compare the effect.
How much daylight actually reaches a desk on this floor, once the neighbours block the sky. Resolved floor by floor.
Explore the possibilities
Explore examples for design teams, property owners, cities and operators. Open a demo and try it.
These demos show possible workflows. Results support early decisions and scenario comparison.
02
Climate physics, one API call away. Tiling, polling and merging are handled for you — you get a field back, not a job queue to babysit.
# pip install infrared-sdk
from infrared_sdk import Client

client = Client(api_key)
run = client.run_area(
    polygon=aoi,
    analysis="thermal-comfort")

heat = run.result()   # → a field, in seconds
Open it as a guest and walk through five public case studies — before you sign up for anything.
900 tokens on signup, valid 42 days · no credit card
The engine inside the tools your team already has open — run analyses without leaving your model.
 GRASSHOPPER GRASSHOPPER | plugin · Rhino 8 script components | Live | → |
 REVIT REVIT | add-in | Live | → |
 QGIS QGIS | plugin | Live | → |
 ARCGIS ARCGIS | connector | Live | → |
 SKETCHUP SKETCHUP | extension | Soon | → |
| AGENT SKILLS | Claude Code · Cursor · Copilot | Docs | → |
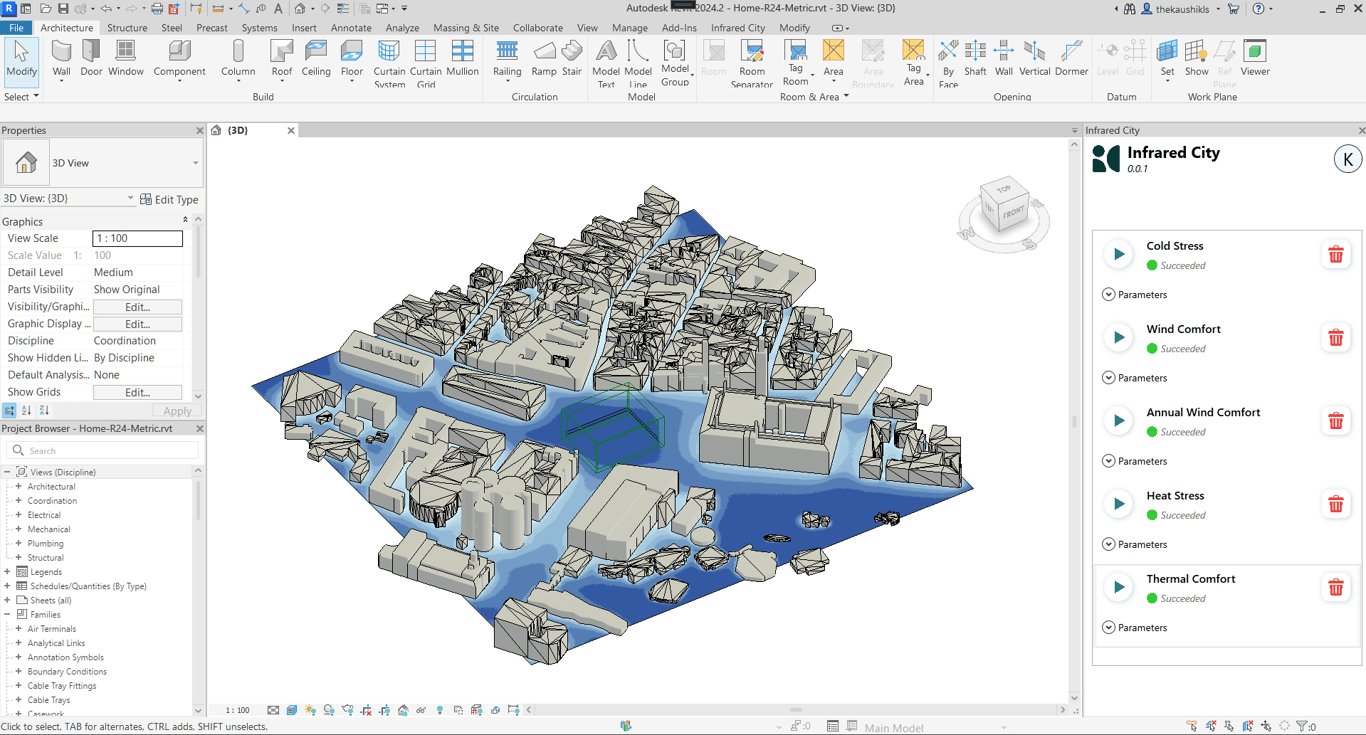
When the deployment has to fit you rather than the other way round — a city-scale layer, a bespoke workflow, or the engine inside your own environment.
Already built on the engine: Glint (café comfort) · Route Analyzer (marathon & commute heat) · Climate Corridor (Riyadh workshop) · a data-centre lifecycle demo · Solar Savings — the full shelf lives in the platform's Integrations tab.

03
All four run on the same engine. Pick the one that sounds like your week.
Put climate physics inside your platform without owning the physics.
API & SDK → 02See where heat is dangerous today, and where the budget should go.
Live layer → 03Submission-ready analysis in an afternoon, not a fortnight.
Workflows → 04Test options while they can still change, inside the tools you use.
Platform & plugins →Not sure? The free tier runs the same engine →

“infrared.city allows us to test design options early on — it helps the designers make informed design decisions from the onset.”

“Real-time analysis that integrates directly into our design software — something most other tools simply can’t offer.”

“Rapidly optimizes design options for the best environmental outcomes — real value to our projects and design process.”
04 · Validation
| Model | Measured against | Status |
|---|---|---|
| Thermal comfort | 2–4 K RMSE on temperate built-up scenes, no per-site calibration | Validated |
| Wind | High agreement against held-out CFD; benchmarked against AIJ wind-tunnel measurements | Screening |
| Daylight sky model | Byte-for-byte identical to the Radiance reference | Exact |
| Per-model studies | Underway; a consolidated overview is in preparation | In progress |
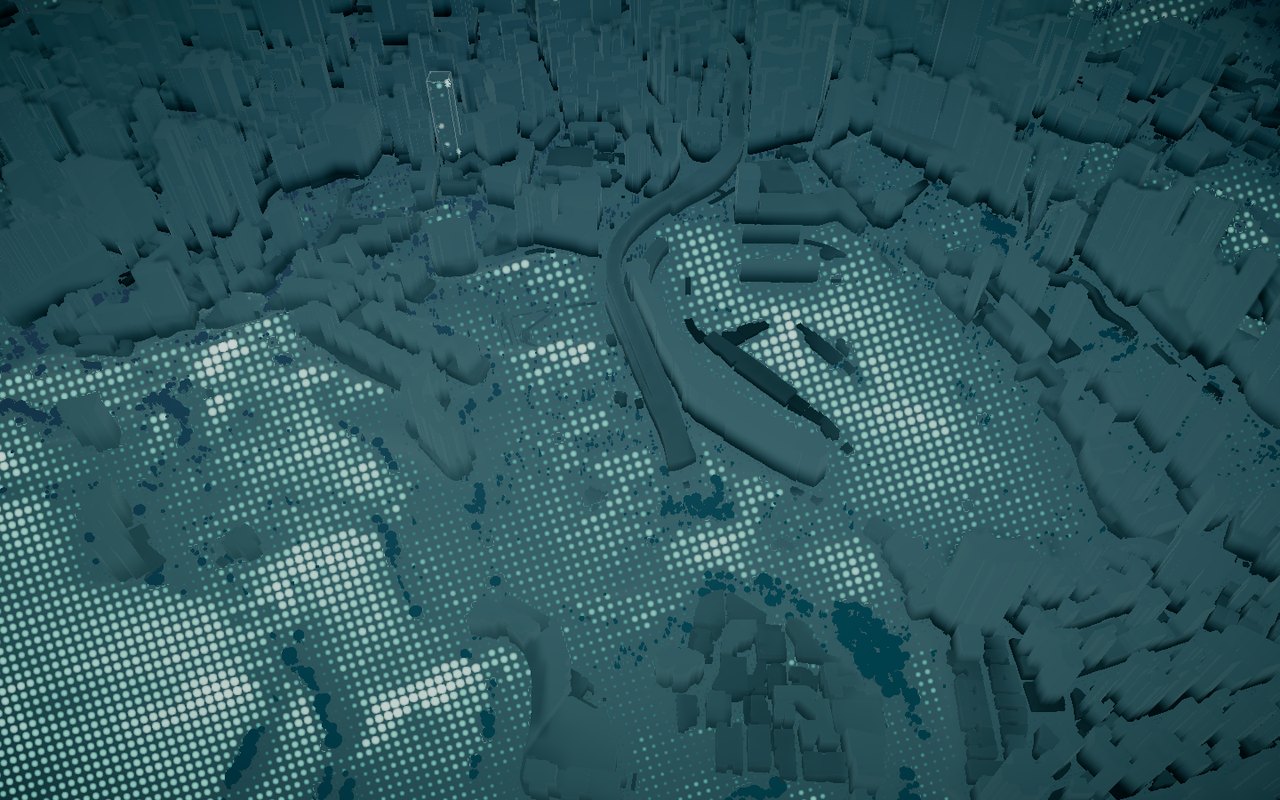
Tiles run in parallel — a district costs barely more time than a single site. Timings are typical and vary with connection.
Screening-grade. Good enough to compare options and find problems — not a certified measurement. We say so because it is what makes the rest trustworthy.
05 · Live
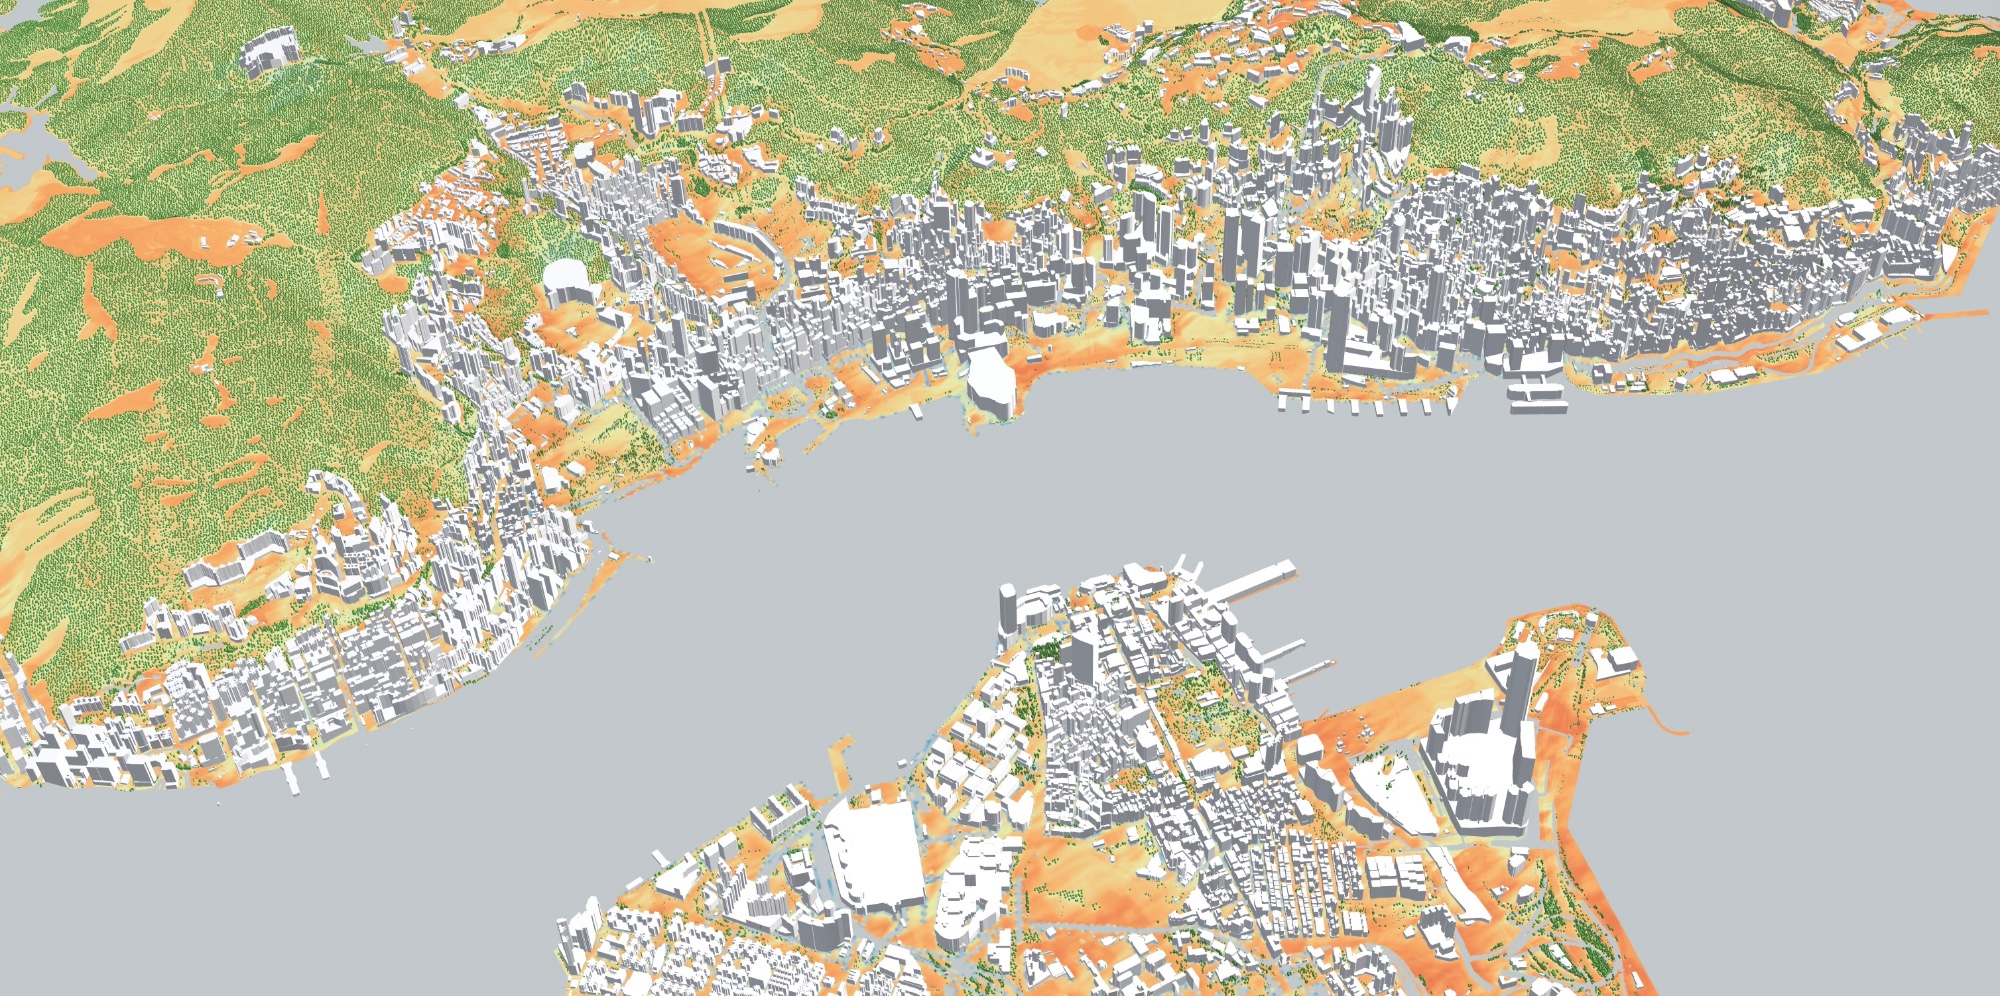
One engine, two ways in — test a design on demand, or explore a live climate layer: hourly forecasts, street by street, 72 hours ahead. Start with Hong Kong or choose another city:
Hong Kong · Harbour area · 1 m · 72 h
06 · Learn
How to run a simulation, read the result, and defend it — tutorials, the knowledge base, the docs and the podcast.
First simulation, plugins, thermal comfort — step by step.
Tutorials → 02Sun paths, comfort criteria, how the engine works.
Read → 03Reference, guides, the SDK and the agent skill.
Docs → 04Conversations on climate and the built environment.
Listen →Start with a small pilot
Bring us a design, a portfolio or a workflow. We can help you define a small pilot or MVP and test it with your team.
Meet us at ReThink HK · 10–11 September ADVANTAGE AUSTRIA pavilion · Booth R42-01 · Hall 1 · HKCEC